Twitter stats using gnuplot, json & make
Latest update:
Twitter allows users to download a subset of their activities as a zip
archive. Unfortunately, there are no useful visualizations available for the
provided data, except for a simple list of tweets with date filtering.
For example, what I expected to find but there were no signs of it:
- a graph of activities over time;
- a list of:
i. the most popular tweets;
ii. users, to whow I reply the most.
Inside the archive there is data/tweet.js file that contains an
array (assigned to a global variable) of "tweet" objects:
window.YTD.tweet.part0 = [ {
  "tweet" : {
    "retweeted" : false,
    "source" : "<a href=\"http://twitter.com\" rel=\"nofollow\">Twitter Web Client</a>",
    "favorite_count" : "2",
    "id" : "12345",
    "created_at" : "Sat Jun 23 16:52:42 +0000 2012",
    "full_text" : "hello",
    "lang" : "en",
    ...
  }
}, ...]
The array is already json-formatted, hence it's trivial to
convert it to a proper json for filtering with json(1) tool.
Say we want a list of top 5 languages in thich tweets were
written. A small makefile:
$ cat lang.mk
lang: tweets.json
    json -a tweet.lang < $< | $(aggregate) | $(sort)
tweets.json: $(i)
    unzip -qc $< data/tweet.js | sed 1d | cat <(echo [{) - > $@

aggregate = awk '{r[$$0] += 1} END {for (k in r) print k, r[k]}'
sort = sort -k2 -n | column -t
SHELL := bash -o pipefail
yields to:
$ make -f lang.mk i=1.zip | tail -5
cs   16
und  286
ru   333
en   460
uk   1075
(1.zip is the archive that Twitter permits us to download.)
To draw activity bars, the same technique is applied: we extract a
date from each tweet object & aggregate results by a day:
2020-12-31 5
2021-01-03 10
2021-01-04 5
This can be fed to gnuplot:
$ make -f plot.mk i=1.zip activity.svg
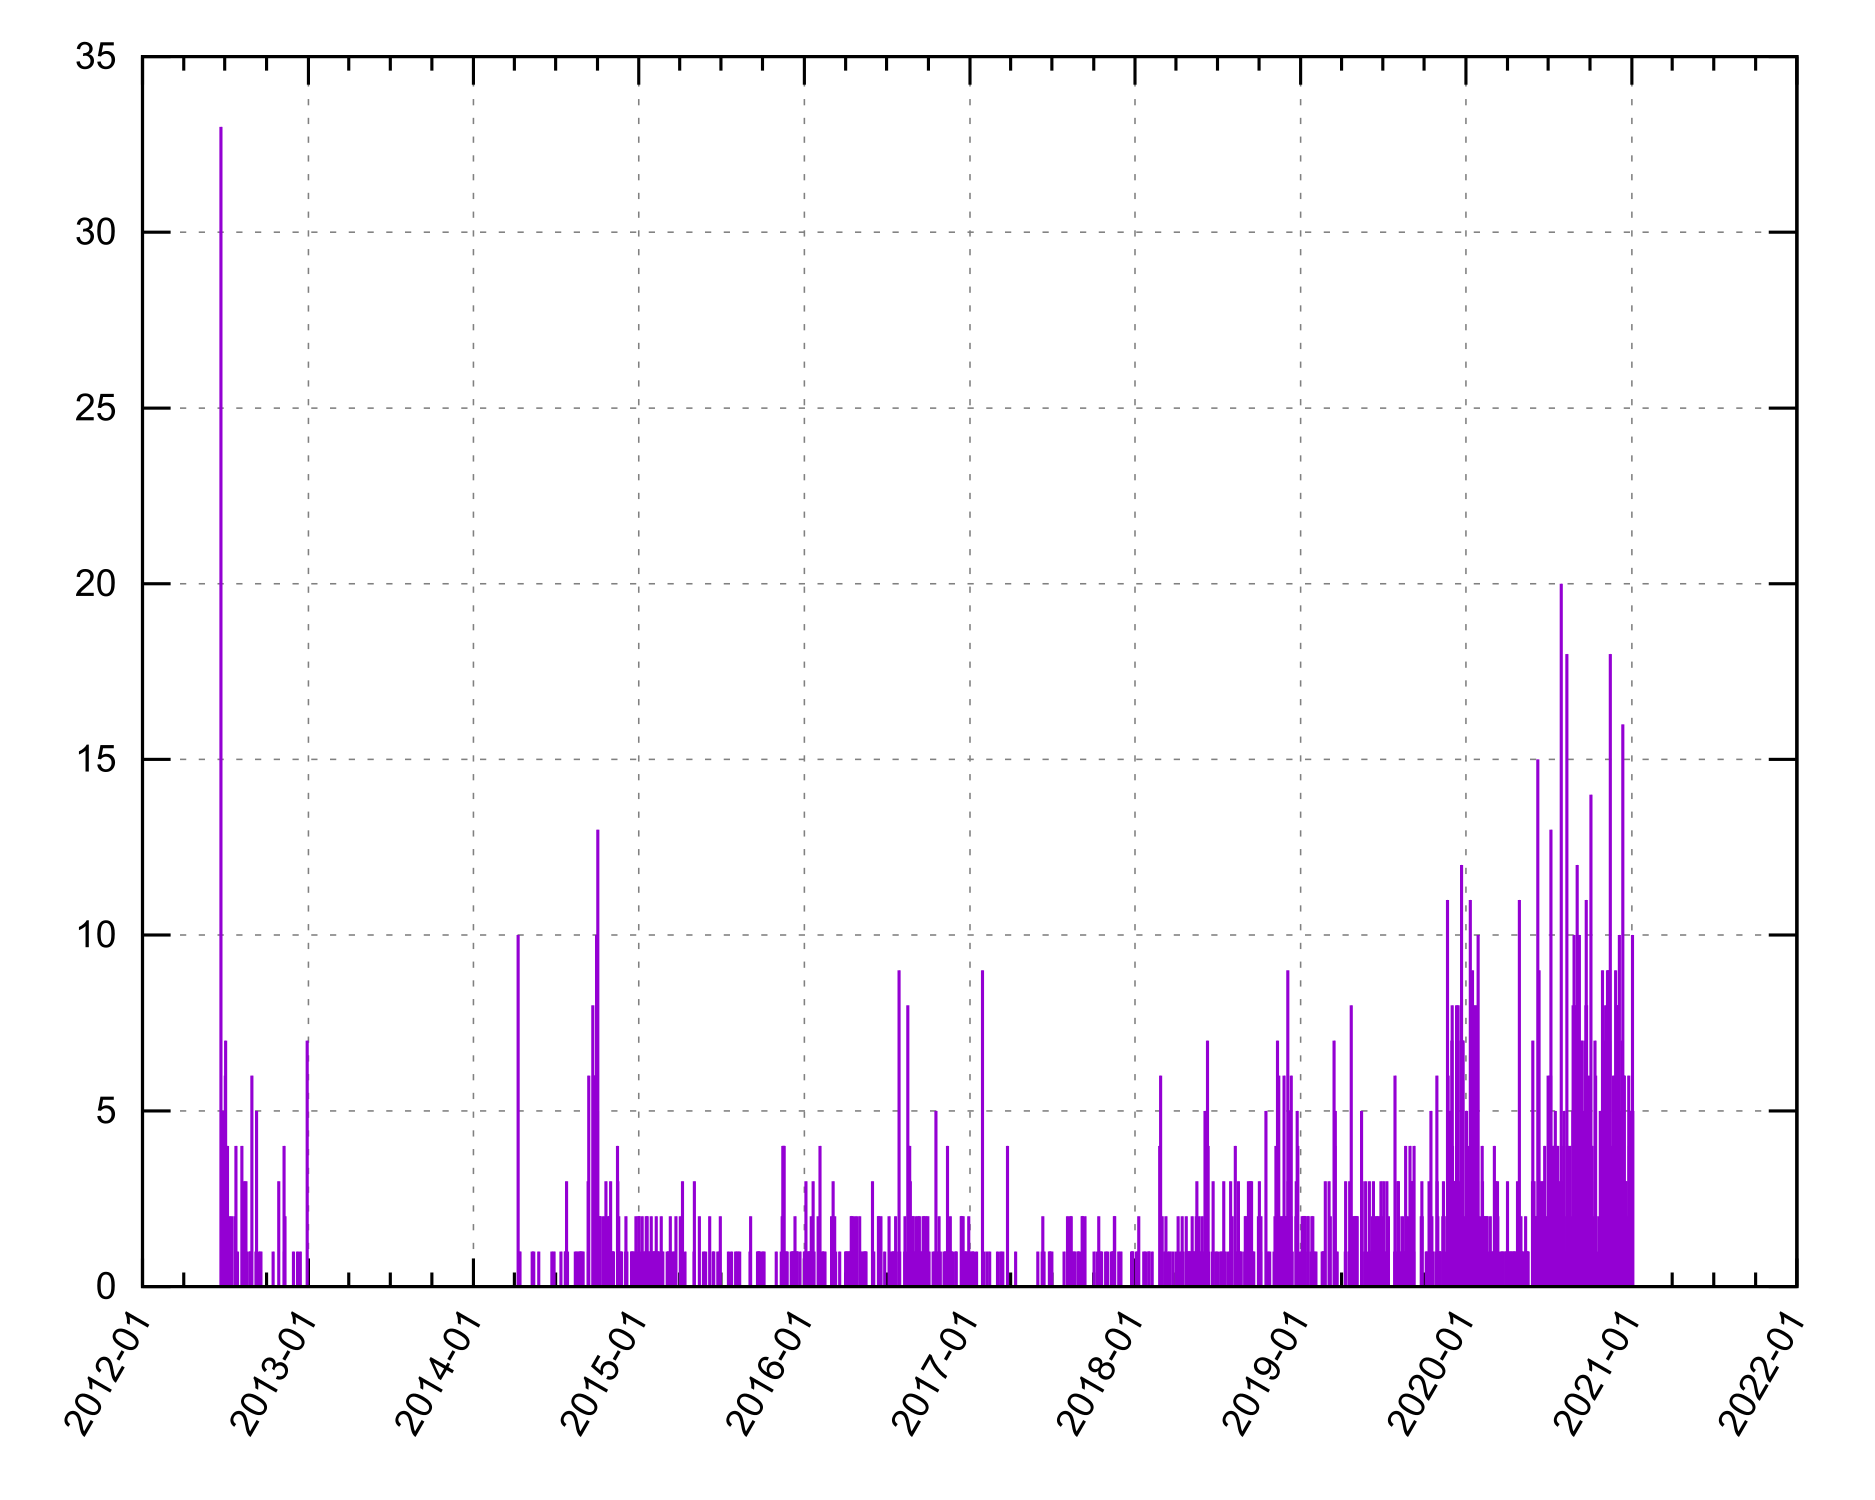
This makefile has an embedded gnuplot script:
$ cat plot.mk
include lang.mk

%.svg: dates.txt
    cat <(echo "$$plotscript") $< | gnuplot - > $@

dates.txt: tweets.json
    json -e 'd = new Date(this.tweet.created_at); p = s => ("0"+s).slice(-2); this.tweet.date = [d.getFullYear(), p(d.getMonth()+1), p(d.getDate())].join`-`' -a tweet.date < $< | $(aggregate) > $@

export define plotscript =
set term svg background "white"
set grid

set xdata time
set timefmt "%Y-%m-%d"
set format x "%Y-%m"

set xtics rotate by 60 right

set style fill solid
set boxwidth 1

plot "-" using 1:2 with boxes title ""
endef
To list users, to whom one replies the most, is quite simple:
$ cat users.mk
users: tweets.json
    json -e 'this.users = this.tweet.entities.user_mentions.map( v => v.screen_name).join`\n`' -a users < $< | $(aggregate) | $(sort)

include lang.mk
I'm not much of a tweeter:
$ make -f users.mk i=1.zip | tail -5
<redacted>       41
<redacted>       49
<redacted>       60
<redacted>       210
<redacted>       656
Printing the most popular tweets is more cumbersome. We need to:
- calculate the rating of each tweet (by a such a complex foumula as
favorite_count + retweet_count);
- sort all the tweet objects;
- slice N tweet objects.
A Make recipe for it is a little too long to show here, but you can
grab a makefile that contains the recipe + all the recipes shown
above.
Tags: ойті
Authors: ag